
TL;DR
- RNA-Seq downstream analysis transforms raw sequencing data into meaningful biological insights.
- Best practices include optimizing experimental design, managing computational resources, ensuring reproducibility, and validating results.
- Common challenges include batch effects, low-expression gene analysis, and complex experimental designs.
- Tools like Biostate AI simplify RNA-Seq analysis by offering affordable sequencing, advanced analytics, and AI-powered insights for improved research outcomes.
You’ve successfully sequenced your RNA samples, and now you’re sitting with terabytes of raw sequencing data. But here’s the reality: those raw reads represent only the beginning of your scientific journey. The true discoveries emerge when you transform this data into meaningful biological insights through sophisticated downstream analysis methodologies.
RNA sequencing has revolutionized gene expression studies, but the explosion of sequencing data presents a challenge in extracting meaningful insights. As sequencing becomes more affordable, the bottleneck now lies in transforming raw data into biological discoveries through advanced computational methods.
We know that facing terabytes of raw RNA-Seq data and the daunting process of transforming them into actionable insights can feel overwhelming, even for seasoned researchers or large-scale biobanks. If you’ve struggled with batch effects, technical limitations, or just knowing where to begin, you’re not alone.
This guide provides essential tools and methodologies to maximize the value of your RNA-Seq data in exploring diverse biological questions.
What Is RNA-Seq Downstream Analysis?
RNA-Seq downstream analysis refers to the series of computational and statistical methods used to interpret the raw data generated from RNA sequencing (RNA-Seq) experiments. The goal of downstream analysis is to extract meaningful biological insights, such as gene expression levels, alternative splicing events, differential gene expression, and functional annotations.
This stage follows after the completion of sequencing and primary data processing, where raw BCL files are converted into FASTQ format using tools like bcl2fastq. Once FASTQ files are generated, downstream analysis begins.
Now that we’ve established the foundational concept of RNA-Seq downstream analysis, it’s time to delve into the critical steps that guide this process from raw data to meaningful biological insights.
Key Steps in RNA-Seq Downstream Analysis
The first step in any downstream analysis is ensuring the integrity of your data. By performing comprehensive quality control, you can identify potential issues that may interfere with subsequent analyzes.
Step 1: Comprehensive Quality Control and Data Preprocessing
You begin every analysis by rigorously assessing data quality using tools like FastQC and MultiQC. These platforms evaluate per-base quality scores, sequence duplication levels, GC content bias, and adapter contamination. Quality control reveals technical issues that could compromise downstream analyzes and guides preprocessing decisions.
Critical Quality Metrics:
- Per-base quality scores: Ensure Phred scores exceed 30 for reliable base calling
- Sequence length distribution: Identify premature read truncation or adapter dimers
- GC content analysis: Detect amplification biases that affect quantification accuracy
- Duplication assessment: Distinguish PCR duplicates from genuine high-expression genes — high duplication rates may either indicate technical bias or true biological signal from highly expressed genes. Some pipelines allow targeted quantification of repetitive regions or TE-derived transcripts (e.g., TEtranscripts), turning multi-mapping into an informative feature
You then apply preprocessing tools like Trimmomatic or fastp to remove low-quality bases, trim adapter sequences, and filter reads that don’t meet quality thresholds. These steps directly impact alignment accuracy and expression quantification reliability.
Step 2: Splice-Aware Read Alignment
With the data cleaned and preprocessed, the next critical task is aligning the reads to the reference genome, ensuring that every sequence is mapped correctly to enable accurate gene expression quantification.
Modern RNA-Seq analysis requires alignment algorithms that accommodate the complex structure of eukaryotic transcripts. You employ splice-aware aligners like STAR, HISAT2, or TopHat2 that can accurately map reads spanning exon-exon junctions.
Advanced Alignment Strategies:
- Two-pass alignment: STAR’s innovative approach that discovers novel splice junctions in an initial pass, then uses this information to improve alignment accuracy in subsequent passes
- Hierarchical indexing: HISAT2’s memory-efficient approach that enables rapid alignment while maintaining sensitivity for splice junction detection
- Multi-mapping resolution: Sophisticated algorithms that handle reads mapping to multiple genomic locations, particularly important for gene families and repetitive elements
You configure alignment parameters to balance sensitivity and specificity, considering factors like minimum intron length, maximum number of mismatches, and splice junction annotation integration.
Step 3: Robust Expression Quantification
Once alignment is complete, the focus shifts to accurately quantifying gene expression. Expression quantification transforms aligned reads into numerical estimates that accurately reflect transcript abundance.
You choose between traditional count-based approaches and modern pseudo-alignment methods based on your experimental goals and computational resources.
Traditional Counting Methods:
- HTSeq-count: Provides a straightforward enumeration of reads overlapping annotated features
- featureCounts: Offers superior computational efficiency and flexible feature assignment options
- RSEM: Implements expectation-maximization algorithms for handling multi-mapping reads
Modern Pseudo-Alignment Approaches:
- Salmon: Combines lightweight alignment with sophisticated bias correction models
- Kallisto: Provides ultra-fast quantification through k-mer-based pseudo-alignment
- StringTie: Enables transcript assembly and quantification in a unified framework
You select normalization strategies that account for technical artifacts while preserving the biological signal. TPM (Transcripts Per Million) normalization has largely superseded RPKM/FPKM due to improved cross-sample comparability.
Step 4: Statistical Analysis and Differential Expression
Statistical analysis represents the analytical core where you identify genes exhibiting significant expression changes between experimental conditions. Modern approaches account for the discrete nature of count data through negative binomial modeling.
Leading Statistical Frameworks:
- DESeq2: Implements sophisticated shrinkage estimation for log fold changes and provides robust dispersion modeling for complex experimental designs. You benefit from integrated normalization, outlier detection, and multiple testing correction.
- edgeR: Offers flexible generalized linear model frameworks that accommodate complex experimental designs including time courses, paired samples, and batch effects. The platform provides excellent performance for smaller sample sizes.
- limma-voom: Transforms count data for linear modeling while maintaining the mean-variance relationship characteristic of RNA-Seq data. You gain access to limma’s mature statistical ecosystem and visualization tools.
You implement rigorous multiple testing correction using False Discovery Rate (FDR) control, typically maintaining FDR ≤ 0.05 for reliable discovery while balancing sensitivity and specificity.
Step 5: Advanced Functional Annotation and Pathway Analysis
Having identified differentially expressed genes, the next logical step is to interpret their functional roles within biological pathways. Functional annotation transforms gene lists into biological insights through systematic integration with curated biological knowledge databases.
Pathway Enrichment Methodologies:
- Over-representation Analysis (ORA): Tests whether differentially expressed genes are statistically over-represented in predefined biological pathways using hypergeometric testing frameworks.
- Gene Set Enrichment Analysis (GSEA): Evaluates whether pathway genes collectively exhibit coordinated expression changes, considering the entire expression profile rather than arbitrary significance thresholds.
- Topology-Aware Methods: Incorporate pathway structure and gene interaction networks to provide more nuanced biological interpretations.
Popular tools used for functional annotation and pathway analysis include ClusterProfiler, DAVID, and g:Profiler, which support integration with databases like Gene Ontology (GO), KEGG, Reactome, and others relevant to specific research domains.
To ensure that your findings are robust and reproducible, it’s essential to consider best practices in experimental design and computational resource management, which can significantly impact the quality of your analysis.
Best Practices and Considerations in Downstream Analysis in RNA Sequencing
Effective RNA-Seq analysis depends not only on robust computational techniques but also on strong experimental design and resource management. This section outlines best practices for experimental planning, computational resource management, and ensuring reproducibility.
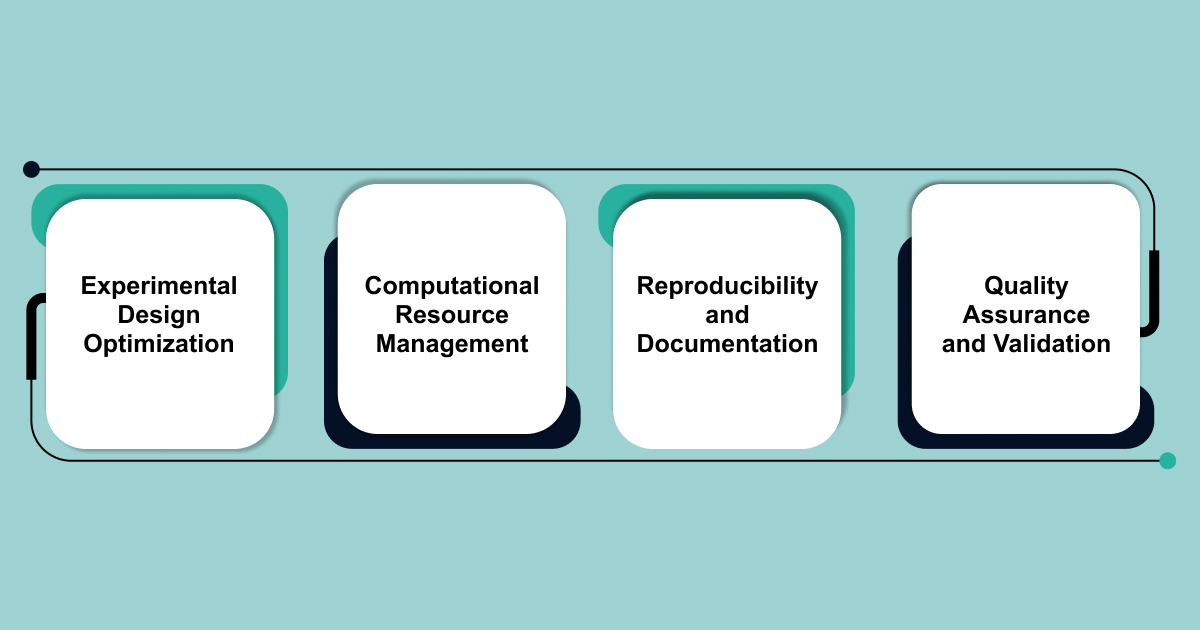
1. Experimental Design Optimization
Strong downstream analysis begins with thoughtful experimental design. You ensure adequate statistical power through appropriate sample size calculations, typically recommending a minimum of n = 3 biological replicates, with n ≥ 5–6 preferred for robust statistical power, especially in human or heterogeneous samples.
Critical Design Elements:
- Biological replication: Prioritize biological over technical replicates for meaningful statistical inference
- Randomization strategies: Minimize systematic biases through proper sample randomization
- Batch effect management: Balance experimental conditions across processing batches when possible
- Confounding variable control: Identify and control for potential confounding factors during experimental planning
2. Computational Resource Management
Modern RNA-Seq analysis demands substantial computational resources. You optimize workflows by understanding memory and processing requirements for each analytical component.
Resource Optimization Strategies:
- Alignment efficiency: Choose aligners appropriate for your data volume and computational constraints
- Memory management: Configure tools to operate within available memory limits while maintaining performance
- Parallel processing: Leverage multi-core processing and cluster computing for large-scale analyzes
- Storage optimization: Implement efficient data storage and archival strategies for large genomic datasets
3. Reproducibility and Documentation
You establish reproducible analytical workflows through comprehensive documentation, version control, and standardized computational environments.
Reproducibility Framework:
- Workflow management: Implement systems like Snakemake or Nextflow for reproducible pipeline execution
- Environment specification: Use containerization (Docker) or environment management (conda) for consistent software versions
- Parameter documentation: Maintain detailed records of all analytical parameters and software versions
- Data provenance: Track data lineage from raw reads through final results
4. Quality Assurance and Validation
Implement multiple quality checkpoints throughout your analytical workflow to ensure reliable results.
Validation Strategies:
- Technical validation: Confirm key findings through qRT-PCR or alternative platforms
- Biological validation: Validate findings in independent sample cohorts when possible
- Computational validation: Cross-validate results using alternative analytical approaches
- Literature validation: Compare findings with published results from similar experimental systems
Despite following best practices, RNA-Seq analysis can present a range of challenges. Understanding and mitigating these challenges will improve the accuracy and reliability of your results.
Common Challenges in RNA-Seq Downstream Analysis
RNA-Seq analysis is fraught with several challenges. Understanding and addressing these issues is key to ensuring data reliability and the accuracy of biological inferences. This section highlights common pitfalls and suggests strategies for overcoming them, providing valuable insights into troubleshooting.
- Batch Effects and Technical Confounding
Batch effects represent one of the most pervasive challenges in RNA-Seq analysis, potentially overwhelming genuine biological signals. You encounter batch effects when technical processing variations systematically affect expression measurements.
Sources of Batch Effects:
- Sample processing: Different extraction dates, personnel, or reagent lots
- Library preparation: Varied protocols or kit lots affecting amplification efficiency
- Sequencing runs: Different flow cells, sequencers, or run conditions
- Storage conditions: Sample storage duration and temperature variations
Detection and Correction Strategies:
You identify batch effects through principal component analysis (PCA) and hierarchical clustering that reveal sample grouping by technical rather than biological factors. Correction methods include ComBat for known batch variables, RUVSeq for empirical unwanted variation removal, and SVA for identifying unknown confounding factors.
Implementation Considerations: Balance aggressive correction that removes technical artifacts against overcorrection that eliminates genuine biological variation. Consider batch effects during experimental design by balancing conditions across known technical batches.
- Low Expression Gene Analysis
Genes with low expression levels present unique analytical challenges due to high measurement uncertainty and increased susceptibility to technical noise.
Low Expression Challenges:
- Quantification uncertainty: Poisson noise becomes dominant at low count levels
- Normalization artifacts: Technical biases disproportionately affect low-expression genes
- Statistical power: Reduced ability to detect differential expression for lowly expressed genes
- Biological significance: Distinguishing genuine low expression from technical limitations
Analytical Approaches:
You implement expression filtering strategies that remove genes unlikely to be reliably quantified while preserving biologically relevant low-expression genes. Modern statistical methods like DESeq2 implement independent filtering and shrinkage estimation specifically designed to handle low-count scenarios.
- Multi-Mapping and Repetitive Elements
Sequencing reads that map to multiple genomic locations create quantification ambiguity, particularly problematic for gene families, pseudogenes, and repetitive elements.
Multi-Mapping Scenarios:
- Gene families: Highly similar sequences that share substantial identity
- Processed pseudogenes: Non-functional gene copies that retain sequence similarity
- Repetitive elements: Transposable elements and tandem repeats throughout the genome
- Alternative splicing: Shared exonic sequences between transcript isoforms
Resolution Strategies:
You employ probabilistic allocation methods implemented in tools like RSEM and Salmon that distribute multi-mapping reads based on estimated transcript abundances. Alternative approaches include discarding multi-mapping reads entirely or focusing analyzes on uniquely mapping regions.
- Complex Experimental Designs
Multi-factor experiments, time course studies, and paired sample designs require sophisticated statistical modeling approaches that extend beyond simple two-group comparisons.
Complex Design Scenarios:
- Multi-factor designs: Experiments examining multiple treatment variables simultaneously
- Time course studies: Temporal expression profiling requiring specialized statistical models
- Paired samples: Before/after studies or matched case-control designs
- Nested designs: Hierarchical experimental structures with multiple grouping levels
Advanced Statistical Modeling:
You implement generalized linear models (GLMs) that accommodate complex design matrices while maintaining appropriate error structures for count data. Mixed-effects models handle paired samples and repeated measures, while specialized time course methods like maSigPro address temporal expression patterns.
- Functional Interpretation and Biological Context
Translating differential expression results into meaningful biological insights requires integration of multiple knowledge sources and careful consideration of experimental context.
Interpretation Challenges:
- Pathway redundancy: Overlapping gene sets across different pathway databases
- Context specificity: Pathway annotations may not reflect tissue or condition-specific biology
- Statistical limitations: Multiple testing burden increases with comprehensive pathway testing
- Biological complexity: Gene functions vary across cellular contexts and developmental stages
Integrative Approaches:
Popular tools for these analyzes include ClusterProfiler, g:Profiler, ReactomePA, and Pathview, which offer visualization and integration with pathway databases. Integration with complementary datasets like proteomics or metabolomics provides additional validation and mechanistic insights.
Transform RNA Sequencing Through Integrated Solutions Like Biostate AI
Despite the power of RNA sequencing, researchers often find themselves overwhelmed by fragmented tools, inconsistent data formats, steep learning curves, and the sheer scale of sequencing datasets. From batch effect correction to functional annotation, each step demands specialized software, deep domain knowledge, and extensive computational infrastructure.
Biostate AI addresses the fundamental challenges researchers face in RNA-Seq analysis by providing comprehensive solutions that span the entire analytical workflow.
Here’s why researhers choose Biostate AI:
- Affordable & Fast: RNA sequencing starts at $80 per sample with results in 1-3 weeks.
- Comprehensive Coverage: Includes mRNA and non-coding RNA sequencing, with minimal sample requirements (e.g., 10µL blood or 10ng RNA).
- Quality Tolerance: Processes degraded RNA (RIN ≥2), unsuitable for traditional platforms.
- Flexible Design: Supports longitudinal and cross-sectional studies, offering experimental design flexibility.
- OmicsWeb: OmicsWeb transforms genomic data analysis with a no-code platform that integrates RNA-Seq, whole genome sequencing, methylation, and single-cell data. It simplifies complex workflows, making AI-powered bioinformatics accessible to all.
- Disease Prognosis AI: Powered by Biobase, Disease Prognosis AI converts RNA expression profiles into predictive tools, aiding personalized medicine by forecasting drug toxicity, therapeutic efficacy, and disease progression. Recently, it has proven 70% accuracy in acute myeloid leukemia treatment selection.
Biostate AI accelerates discovery, improves clinical outcomes, and simplifies genomic data analysis, making cutting-edge biotechnology accessible and actionable.
Final Words!
RNA-Seq downstream analysis is where data transforms into discovery, but the path is far from simple. From rigorous quality control to complex statistical modeling and functional interpretation, every step demands precision, expertise, and scalable tools. The challenge isn’t just in processing data; it’s in doing so accurately, reproducibly, and efficiently at scale.
As RNA-Seq continues to power breakthroughs in biology and medicine, researchers need more than just raw data—they need end-to-end solutions that simplify complexity without sacrificing depth. At Biostate AI, we empower researchers to move from raw reads to publication-ready insights faster.
With sequencing starting at just $80 per sample, built-in QC and analysis pipelines, and AI-powered annotations, Biostate AI removes the technical barriers that often slow research. Whether you’re decoding rare isoforms or identifying key regulators in disease, our integrated platform gives you everything you need, without the bottlenecks.
Get your quote to see how Biostate AI can help you streamline your workflow and make your next breakthrough faster.
FAQs
1. What are the minimum computational requirements for comprehensive RNA-Seq downstream analysis?
For standard differential expression analysis with moderate sample sizes (n=10-50 per condition),
- RAM: Minimum 32GB (64GB recommended).
- CPU: 16-32 cores.
- Storage: 500GB SSD for temporary data, 50-100GB per sample for long-term storage.
- Advanced analysis (e.g., single-cell RNA-Seq): High-performance computing clusters or cloud solutions may be necessary.
Scalable cloud-based solutions can also provide flexible, cost-effective computational resources for varying analysis needs.
2. How do I determine the appropriate statistical power and sample size for RNA-Seq experiments?
To determine statistical power and sample size for RNA-Seq, consider factors like expected fold changes, baseline expression levels, and acceptable error rates. Tools like RnaSeqSampleSize and PROPER can assist in calculations. For moderate effects (2-fold changes), 6-8 replicates per condition provide 80% power, while subtle effects may need 15-30 replicates. Pilot studies (n=3-4) help estimate dispersion and effect sizes for optimizing calculations.
3. What strategies effectively address batch effects while preserving genuine biological variation?
Use randomized block designs to distribute biological conditions across batches. Computational methods like ComBat, RUVSeq, and SVA can correct batch effects but should be used cautiously to avoid removing biological signals. Validate corrections with PCA, clustering, and sensitivity analyzes to ensure reliable results.
4. How do modern pseudo-alignment methods compare to traditional alignment approaches for expression quantification accuracy?
Modern pseudo-alignment methods (e.g., Salmon, Kallisto) are faster and computationally efficient, with quantification accuracy within 2-5% of traditional methods. They use k-mer compatibility rather than full sequence alignment. While pseudo-alignment is ideal for large-scale studies, traditional alignment is better for splice junction analysis and novel transcript discovery. Hybrid strategies combine both approaches for comprehensive results.