
RNA sequencing (RNA-seq) clustering represents a fundamental computational approach for deciphering complex transcriptomic landscapes and identifying functionally coherent gene expression patterns. This sophisticated analytical framework enables researchers to systematically organize high-dimensional genomic data into biologically meaningful clusters, facilitating the discovery of co-expressed gene networks, tissue-specific expression signatures, and disease-associated molecular pathways.
As RNA-seq data increases, we require robust clustering methods to manage its complexity and noise. These tools are essential for transforming raw data into meaningful biological insights, particularly in areas such as precision medicine and identifying new treatment targets.
In this blog, we will understand RNA-Seq clustering analysis from normalization to hierarchical and K-means techniques.
TL;DR
- RNA-seq clustering is a key computational approach to categorize gene expression data, uncovering gene networks and biological patterns relevant for research and medicine.
- Effective clustering relies on careful preprocessing and methods like hierarchical clustering, K-means, and Gaussian mixture models, each suited for specific data types and research objectives.
- Dimensionality reduction and feature selection refine clustering accuracy by focusing on the most biologically informative genes.
- Specialized techniques address challenges in single-cell RNA-seq, enabling the discovery of rare cell populations and dynamic biological changes.
- Comprehensive validation strategies and modern tools/platforms are essential for ensuring meaningful, reproducible clustering results in RNA-seq studies.
What is Clustering in RNA-Seq Analysis?
Clustering in RNA-seq analysis is a machine learning technique that groups together genes or samples with similar activity patterns. This allows researchers to identify genes that may be involved in the same biological processes or functions.
Core Analytical Objectives
RNA-seq clustering serves multiple critical analytical purposes:
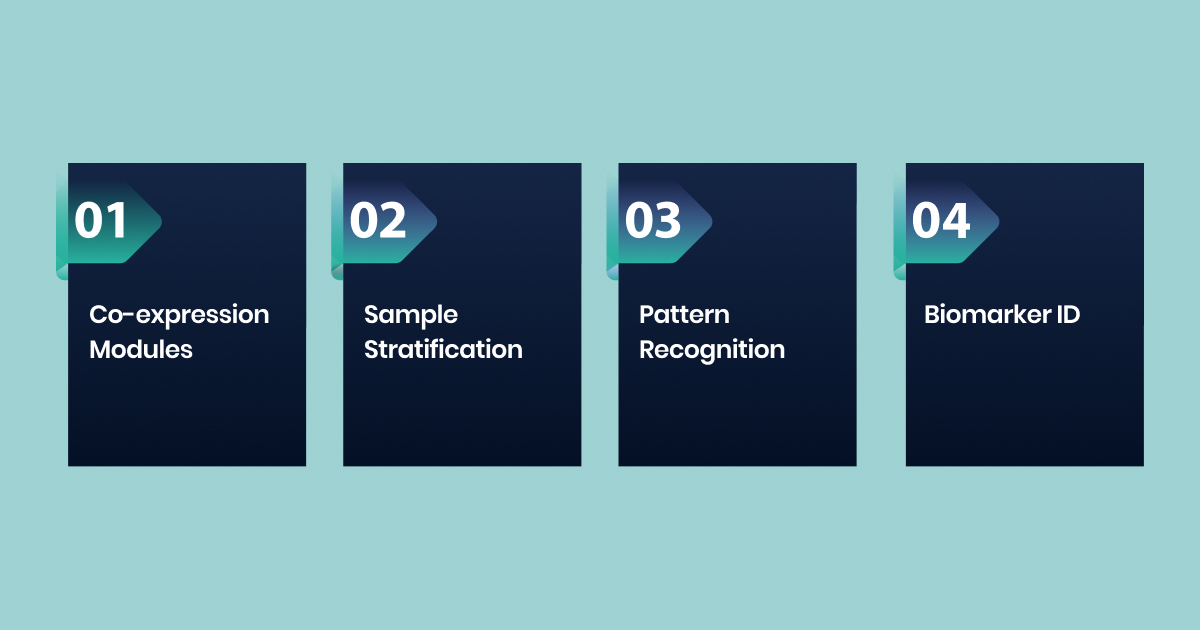
- Gene Co-expression Network Discovery: Identification of functionally related gene modules that respond coordinately to biological stimuli or pathological conditions
- Sample Classification and Stratification: Systematic categorization of biological samples based on global transcriptomic signatures, enabling disease subtyping and treatment stratification
- Temporal Pattern Recognition: Detection of dynamic expression trajectories during developmental processes, cellular differentiation, or disease progression
- Biomarker Identification: Discovery of diagnostic and prognostic gene signatures through systematic expression pattern analysis
The clustering process organizes complex gene expression data into smaller groups by measuring the similarity between data points. It uses mathematical tools to decide how confident we are in each group and to check if the groups are meaningful for biology.
Fundamental Principles and Data Preprocessing
The mathematical foundation of RNA-seq clustering relies on distance metrics and similarity measures that quantify relationships between gene expression profiles. Effective clustering analysis demands rigorous preprocessing protocols to address technical artifacts and systematic biases.
Data Processing in Clustering of RNA-Seq Data
Normalization procedures, including Transcripts Per Million (TPM), Reads Per Kilobase Million (RPKM), and DESeq2’s median-of-ratios approach, ensure expression measurements are comparable across samples. Advanced preprocessing incorporates batch effect correction algorithms, such as ComBat-seq and surrogate variable analysis (SVA), to mitigate confounding technical variations.
Once we have a solid grasp on the basics and preprocessing, we can explore the more advanced clustering methods that take RNA-seq analysis to the next level.
Advanced Clustering Methodologies for RNA-Seq Data
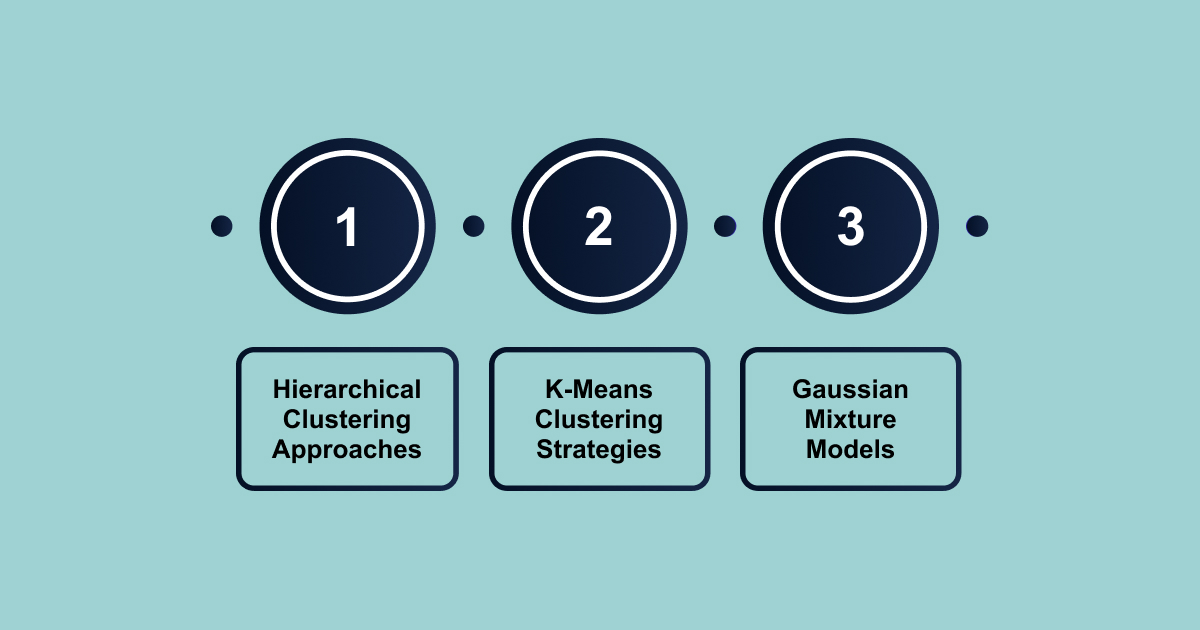
As RNA-seq datasets grow larger and more complex, advanced clustering techniques become necessary. Methods like hierarchical clustering, K-means, and Gaussian mixture models give you the flexibility to tackle high-dimensional data. Knowing when and how to use each of these methods is key to getting accurate, biologically meaningful results.
1. Hierarchical Clustering Approaches
Hierarchical clustering represents one of the most established and widely implemented methodologies for RNA-seq data analysis, providing systematic organization of transcriptomic data through tree-based dendrogram structures.
This approach offers exceptional flexibility through both agglomerative (bottom-up) and divisive (top-down) algorithmic variants, enabling comprehensive exploration of nested cluster relationships within complex expression datasets.
Core Algorithmic Strategies
Agglomerative Hierarchical Clustering:
- Initialization Process: Individual genes commence as separate singleton clusters
- Iterative Merging Protocol: Systematic combination of the most similar clusters based on predefined linkage criteria
- Termination Conditions: Process continues until all elements form a unified hierarchical structure
Primary Linkage Methodologies:
- Single Linkage: Minimum distance between cluster elements (prone to chaining effects)
- Complete Linkage: Maximum distance criterion (produces compact, spherical clusters)
- Average Linkage: Mean pairwise distance calculation (balanced approach)
- Ward’s Method: Minimizes within-cluster sum-of-squares variance
Distance Metric Selection and Implications
The selection of appropriate distance metrics profoundly influences clustering outcomes and biological interpretability:
Euclidean Distance:
- Measures geometric proximity in multi-dimensional expression space
- Optimal for continuous expression data with magnitude considerations
- Sensitive to absolute expression level differences
Pearson Correlation Distance:
- Emphasizes expression pattern similarity independent of magnitude
- Reduces sensitivity to absolute expression differences
- Ideal for identifying co-expression relationships
Spearman Correlation Distance:
- Provides robustness against outliers and non-linear relationships
- Focuses on rank-order relationships between expression profiles
- Suitable for datasets with non-normal distributions
2. K-Means Clustering Strategies
K-means clustering constitutes a centroid-based partitional methodology that demonstrates exceptional computational efficiency for large-scale RNA-seq datasets. This approach partitions transcriptomic data into predetermined clusters by iteratively optimizing cluster centroids through minimization of within-cluster sum of squared distances (WCSS).
The algorithm’s mathematical foundation relies on Lloyd’s algorithm, which alternates between cluster assignment and centroid update phases until convergence criteria are satisfied.
Core Algorithmic Components
Initialization Procedures:
- Random Centroid Placement: Stochastic initialization of cluster centers
- K-means++ Algorithm: Intelligent centroid selection to improve convergence
- Multiple Initialization Trials: Repetitive execution to avoid local optima
Optimization Criteria:
- Within-Cluster Sum of Squares (WCSS): Primary objective function minimization
- Silhouette Coefficient: Cluster quality assessment metric
- Convergence Tolerance: Algorithmic termination threshold
Advanced Partitional Clustering Variants
K-Medoids Clustering (PAM Algorithm):
- Medoid-Based Representation: Utilizes actual data points as cluster representatives
- Robustness Against Outliers: Enhanced stability compared to centroid-based approaches
- Manhattan Distance Compatibility: Suitable for non-Euclidean distance metrics
Fuzzy C-Means Clustering:
- Probabilistic Membership Assignment: Permits partial cluster membership
- Soft Clustering Methodology: Accommodates genes with intermediate expression patterns
- Membership Function Optimization: Iterative refinement of fuzzy membership coefficients
3. Gaussian Mixture Models
Model-based clustering employs advanced statistical techniques that treat gene expression data as if they originate from distinct subgroups or patterns, often modeled using mathematical distributions known as Gaussian mixture models.
These probabilistic frameworks employ maximum likelihood estimation principles through expectation-maximization (EM) algorithms to simultaneously determine optimal model parameters and cluster assignments while providing quantitative measures of cluster membership confidence.
Core Statistical Components
Gaussian Mixture Model Architecture:
- Component Distribution Parameters: Mean vectors, covariance matrices, and mixing proportions
- Likelihood Function Optimization: Maximum likelihood parameter estimation procedures
- Posterior Probability Calculation: Probabilistic cluster membership assignments
Expectation-Maximization Algorithm:
- E-Step (Expectation): Calculation of posterior cluster membership probabilities
- M-Step (Maximization): Parameter updates based on weighted likelihood maximization
- Convergence Assessment: Log-likelihood improvement monitoring
Model Selection and Optimization Criteria
Information-Theoretic Criteria:
- Bayesian Information Criterion (BIC): Balances model complexity against goodness-of-fit
- Akaike Information Criterion (AIC): Alternative model selection framework
- Integrated Completed Likelihood (ICL): Incorporates clustering quality assessment
Advanced Implementation Features:
- Variable Selection Procedures: Identification of informative genes for clustering analysis
- Regularization Techniques: Prevention of overfitting in high-dimensional data
- Bootstrap Resampling: Cluster stability assessment methodologies
To refine our clustering results even further, we employ techniques such as dimensionality reduction and feature selection, which help simplify complex data while preserving the key biological signals.
Dimensionality Reduction and Feature Selection Techniques for RNA-seq Clustering
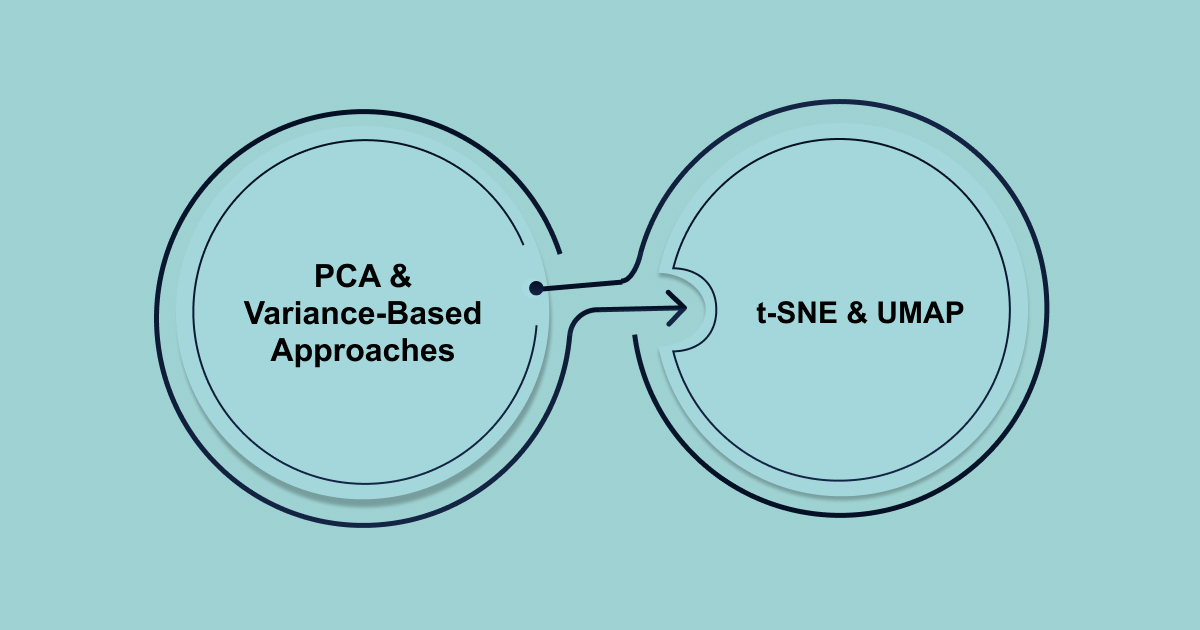
RNA-seq data can be overwhelming because of its high dimensionality. That’s where dimensionality reduction and feature selection come in. Techniques like PCA, t-SNE, and UMAP help reduce the complexity of the data while keeping the important biological information intact. Meanwhile, feature selection makes sure you’re focusing on the genes that matter most for your analysis.
- Principal Component Analysis and Variance-Based Approaches
Principal Component Analysis (PCA) constitutes a fundamental linear dimensionality reduction methodology that transforms high-dimensional RNA-seq expression matrices into lower-dimensional subspaces through eigenvalue decomposition of covariance structures.
This orthogonal transformation systematically identifies linear combinations of original variables (principal components) that capture maximal variance in the dataset, enabling effective visualization and clustering of complex transcriptomic landscapes while preserving essential biological signal characteristics.
- t-SNE and UMAP for Non-Linear Dimension Reduction
Advanced non-linear dimensionality reduction techniques, including t-Distributed Stochastic Neighbor Embedding (t-SNE) and Uniform Manifold Approximation and Projection (UMAP), excel at preserving local neighborhood structures in high-dimensional expression data.
UMAP demonstrates superior performance in preserving both local and global data structure compared to t-SNE while maintaining computational efficiency for large datasets.
While these techniques work well for general RNA-seq analysis, single-cell RNA-seq requires special approaches to handle the unique challenges of cellular diversity.
Specialized Clustering Approaches for Single-Cell RNA-Seq
Single-cell RNA-seq is a bit different due to its unique challenges, like sparsity and cell-to-cell variability. Specialized clustering techniques, such as graph-based methods and trajectory inference, help you tackle these issues. These methods are essential for understanding individual cell behavior, identifying rare cell types, and tracking changes in cell states during development or disease.
- Graph-Based Clustering Methodologies
Single-cell RNA-seq (scRNA-seq) data presents unique analytical challenges due to increased sparsity, technical noise, and cellular heterogeneity. Graph-based clustering approaches, including the Leiden and Louvain algorithms, construct nearest-neighbor graphs based on cell-cell similarity metrics and identify densely connected communities as clusters.
These methodologies demonstrate particular effectiveness in detecting rare cell populations and resolving subtle transcriptomic differences between closely related cell types. Resolution parameters allow fine-tuning of cluster granularity to match biological questions and dataset characteristics.
- Trajectory Inference and Pseudotime Analysis
Temporal clustering approaches, including trajectory inference algorithms such as Monocle, PAGA, and RNA Velocity, extend traditional clustering methodologies to capture dynamic biological processes and cellular differentiation trajectories. These techniques reconstruct pseudotemporal orderings of cells and identify transition states between distinct cellular phenotypes.
The integration of clustering with trajectory analysis provides a comprehensive characterization of developmental processes, disease progression, and treatment response dynamics at single-cell resolution.
Once we’ve tackled the specialized clustering for single-cell RNA-seq, the next step is to validate our results and ensure they’re biologically relevant with solid quality assessments.
Validation and Quality Assessment Frameworks for RNA-Seq Clustering
Validation frameworks help ensure that your clusters are biologically relevant and not just statistical artifacts. By using internal metrics and comparing against external data, you can be confident that your results reflect real biological processes and not just noise.
- Internal Clustering Validation Metrics
Rigorous validation procedures are essential for assessing clustering quality and biological relevance. Internal validation metrics, including silhouette coefficient, Calinski-Harabasz index, and Davies-Bouldin index, quantify cluster compactness and separation without requiring external reference standards.
The silhouette coefficient measures how similar each gene is to its assigned cluster compared to neighboring clusters, providing individual and average quality assessments. Values approaching 1 indicate well-separated clusters, while negative values suggest potential misassignments.
- External Validation and Biological Coherence Assessment
External validation approaches evaluate clustering results against established biological knowledge, including Gene Ontology annotations, pathway databases, and literature-curated gene sets. Enrichment analysis tools, such as GSEA and DAVID, assess whether identified clusters demonstrate significant overlap with known functional categories.
Co-expression network analysis provides additional validation by examining whether clustered genes exhibit expected regulatory relationships and transcription factor binding patterns. Integration with protein-protein interaction networks offers orthogonal evidence for functional coherence.
After validation, we need the right tools to implement everything efficiently. Let’s take a look at the computational frameworks and software that make clustering happen.
Computational Implementation and Software Frameworks for RNA-Seq Clustering
To run RNA-seq clustering efficiently, you need the right tools. Software platforms like R and Python offer libraries specifically designed for clustering analysis. These tools help you process large datasets, apply complex algorithms, and create visualizations that make your results easier to interpret.
- R-Based Clustering Ecosystems
The R statistical computing environment provides comprehensive clustering analysis capabilities through specialized packages including cluster, factoextra, and ComplexHeatmap. Bioconductor packages such as DESeq2, edgeR, and limma offer integrated workflows combining differential expression analysis with clustering methodologies.
Advanced packages like SC3, Seurat, and SingleCellExperiment provide specialized tools for single-cell RNA-seq clustering analysis, incorporating state-of-the-art algorithms and visualization capabilities.
- Python-Based Machine Learning Implementations
Python’s scikit-learn library offers robust implementations of classical clustering algorithms, while specialized packages like scanpy and scvi-tools provide cutting-edge single-cell analysis capabilities. TensorFlow and PyTorch frameworks enable deep learning approaches to clustering, including variational autoencoders and neural network-based dimensionality reduction.
Now that we know the tools we’ll use, it’s time to talk about best practices to ensure our clustering analysis is done right and produces reliable results.
Best Practices and Methodological Considerations
To get the best results from RNA-seq clustering, it’s important to follow best practices. This includes proper data preparation, adjusting settings to fit your data, and checking how stable your clusters are.
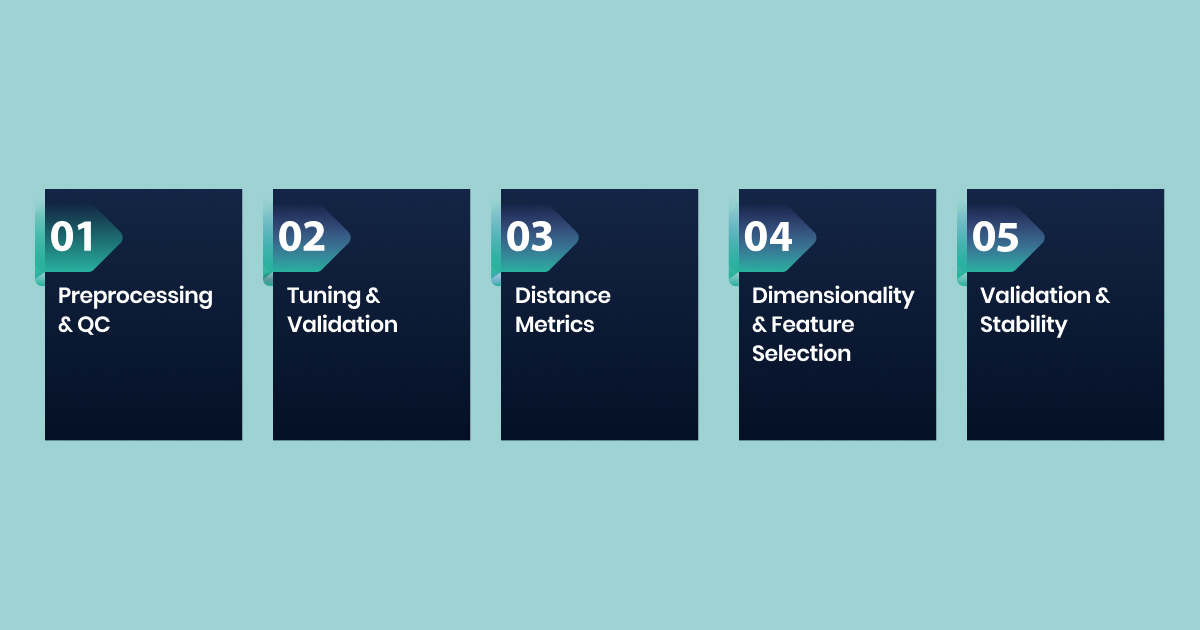
- Data Preprocessing and Quality Control
Start with a solid preprocessing pipeline. This means normalizing the data correctly and fixing any batch effects. You should also check the quality of your data by looking at things like read mapping and how well genes are detected. Doing this ensures your data is ready for clustering.
- Tuning Parameters and Cross-Validation
Make sure to fine-tune your algorithm’s settings for the best performance. You can do this through methods like grid search. Using cross-validation checks if your clusters are stable and consistent. It’s also important to test different settings to find the most reliable results.
- Choosing the Right Distance Metrics
Pick the right distance metrics based on your research goals. For example, use correlation-based metrics to find gene co-expression patterns, or Euclidean distances when examining gene expression levels. If you’re working with single-cell RNA-seq, use specialized metrics that work best for that type of data.
- Dimensionality Reduction and Feature Selection
To handle complex data, reduce its dimensions with techniques like PCA, t-SNE, or UMAP. These methods help visualize and simplify the data. You should also focus on selecting the most relevant genes, using methods like ICA or NMF, to make the data easier to interpret.
- Validation and Stability Checks
It’s essential to validate your clusters to ensure they’re meaningful. Use internal metrics like silhouette scores and external checks like pathway analysis. You should also test for stability using resampling techniques and ensure that your results hold up in additional experiments.
By following these steps, you can ensure that your clustering results are accurate, reliable, and biologically meaningful.
However, even with the best practices in place, there are still some challenges and limitations we have to watch out for in RNA-seq clustering.
Challenges and Limitations in RNA-Seq Clustering
RNA-seq clustering is a powerful tool, but it does have some challenges. Technical issues, such as noise, batch effects, and determining the optimal number of clusters, can impact your results. Understanding these challenges can help you plan better and get more reliable results.
- Technical Noise and Batch Effects
RNA-seq data can be affected by things like differences in lab setups, sequencing depth, and platform biases. These technical issues can hide the true biological signals and create misleading clusters. To address this, we need smart computational methods, but sometimes these methods can also remove real biological variation by mistake.
- Data Complexity and Scalability
RNA-seq data is growing fast, especially with single-cell genomics. This creates big challenges in terms of memory, processing power, and time. Traditional clustering methods can struggle with large datasets, especially when there are millions of cells or thousands of genes. We may need new methods or more powerful computing systems to handle this.
- Choosing the Right Number of Clusters
Deciding how many clusters to use can be a challenging task. Statistical methods don’t always align with biological reality, which can result in either an overestimation or underestimation of clusters. This is especially challenging when studying complex or transitional biological processes, like changes in cell states.
- Single-Cell RNA-Seq Sparsity
Single-cell RNA-seq data tend to be sparse due to technical dropout events and differences in gene expression. Traditional clustering methods may not work well with sparse data. We require specialized techniques that can distinguish between genuine biological zeros and technical issues, while still capturing the full range of cell diversity.
- Integrating Data from Different Sources
In modern genomics, we often combine RNA-seq data with other types of data, like ATAC-seq or proteomics. This can create challenges in harmonizing the data, correcting biases, and developing methods that work across different platforms. Combining these data types while maintaining their biological meaning can be complex and time-consuming.
How Biostate AI’s Advanced RNA-Seq Solutions Can Help You?
Biostate AI represents a paradigm-shifting computational biology platform that democratizes advanced RNA-seq clustering methodologies through integrated wet-lab and bioinformatics workflows. Our comprehensive solution eliminates traditional barriers between experimental execution and sophisticated analytical interpretation.
We offer:
- Total RNA-Seq Processing: Complete transcriptome analysis covering both mRNA and non-coding RNA species with high-throughput sequencing protocols
- Multi-Sample Type Compatibility: Processing capability for blood, tissue, cell culture, and purified RNA samples with minimal input requirements (10µL blood, 10ng RNA, 1 FFPE slide)
- Degraded Sample Tolerance: Advanced processing protocols compatible with RNA samples exhibiting RIN scores as low as 2 (versus typical ≥5 requirements)
- Flexible Experimental Design Support: Accommodation of longitudinal time-course studies, cross-sectional comparative analyses, and multi-condition experimental frameworks.
- Multi-Omics Data Integration: Seamless incorporation of complementary genomics datasets (ATAC-seq, ChIP-seq, methylation profiles) for enhanced clustering validation and biological interpretation.
- Economical Pricing Structure: High-quality total RNA sequencing starting at $80 per sample, significantly reducing traditional economic barriers to advanced clustering analysis
- Rapid Turnaround Timeline: Complete analysis delivery within 1-3 weeks, accelerating research timelines and enabling iterative experimental design approaches.
- Scalable Research Integration: Flexible platform architecture accommodating both small-scale pilot studies and large-scale consortium research initiatives.
At Biostate AI, we can tackle the challenges we just discussed and unlock the full potential of RNA-seq clustering for groundbreaking research.
Final Words
RNA-seq clustering is a key method in genomics research. It helps organize and interpret complex data, leading to new biological insights and potential treatments.
But the technical complexity, high costs, and resource demands have made it hard for many researchers to access these advanced tools.
Biostate AI addresses this challenge by offering a powerful RNA sequencing platform that makes advanced genomics analysis more accessible. Our platform is cost-effective, starting at just $80 per sample, and provides quick results in 1-3 weeks. This makes it easier for researchers to focus on discovery rather than the technical challenges.
If you’re ready to explore RNA-seq clustering for your research, get a personalized quote today and see how Biostate AI can help you move from samples to breakthrough insights.
Frequently Asked Questions
What is the optimal number of clusters for RNA-seq data analysis?
The optimal cluster number depends on biological context, dataset characteristics, and research objectives. Statistical criteria, including the elbow method, silhouette analysis, and gap statistic, provide quantitative guidance, while biological validation through pathway enrichment ensures meaningful assignments.
How do I choose between hierarchical and k-means clustering?
Hierarchical clustering excels at revealing nested cluster structures without requiring predetermined cluster numbers, ideal for exploratory analysis. K-means offers computational efficiency for large datasets and produces compact clusters. Consider dataset size, computational resources, and biological expectations.
What preprocessing steps are essential before clustering analysis?
Critical preprocessing steps include read quality assessment, genome alignment, read counting, normalization (using TPM, RPKM, or DESeq2), and batch effect correction. Quality control metrics should assess mapping rates, gene detection sensitivity, and sample correlation patterns.
How can I validate the biological relevance of the clustering results?
Validation approaches include Gene Ontology enrichment analysis, pathway database queries, literature mining, and integration with protein-protein interaction networks. Internal validation metrics assess cluster quality, while external validation confirms biological coherence.
What are the main differences between bulk and single-cell RNA-seq clustering?
Single-cell RNA-seq clustering must address increased sparsity, technical noise, and cellular heterogeneity. Specialized algorithms, including graph-based methods, trajectory inference, and dropout-aware distance metrics, are essential for single-cell analysis.
How do I handle batch effects in multi-sample studies?
Batch effect correction methods, including ComBat-seq, surrogate variable analysis (SVA), and Harmony, can mitigate technical confounding factors. Proper experimental design with balanced sample allocation across batches and appropriate controls are crucial for successful correction.