
The pharmaceutical industry stands at a transformative juncture where traditional drug discovery approaches face unprecedented challenges. Only about 13.8% of drugs make it from Phase I trials to approval, and each successful drug can cost up to $2 billion.
To boost success rates, pharma and biotech companies are turning to advanced tools like single-cell RNA sequencing (scRNA-seq). scRNA-seq gives a detailed look at individual cells, uncovering disease mechanisms that bulk approaches can miss.
But to truly benefit, you must understand sequencing saturation. This key metric shows how much of your sample’s complexity has actually been captured in the sequencing process. It’s a crucial quality check. For companies investing in scRNA-seq, knowing your saturation level is vital for reliable, high-quality results.
In this article, we break down the basics of sequencing saturation in scRNA-seq. You’ll learn why it matters for your drug discovery pipeline, how to set smart goals for your projects, and which best practices can help you get the data you need, while making every research dollar count.
Key Takeaways
- Sequencing saturation measures how comprehensively single-cell RNA sequencing captures sample complexity, impacting data quality and biological insights.
- Optimal saturation ensures detection of rare transcripts and cell types, enhancing target identification, drug screening, and biomarker discovery.
- Under- or over-saturation leads to missed targets, increased costs, and compromised R&D efficiency, affecting the drug discovery pipeline.
- Best practices include tailored experimental design, careful sample preparation, UMI usage, pilot runs, high-throughput platforms, targeted resampling, and advanced computational analysis.
- Integrating these strategies maximizes resource utilization, data accuracy, and confidence in downstream biological interpretations for pharma and biotech applications.
What is Sequencing Saturation in Single-Cell RNA-seq?
Single-cell RNA sequencing (scRNA-seq) offers unparalleled resolution by profiling gene expression at the individual cell level, unlike traditional bulk RNA-seq, which averages signals across millions of cells.
Sequencing saturation in scRNA-seq measures the fraction of transcript diversity captured in a sequencing run. It is typically measured by Unique Molecular Identifiers (UMIs) and indicates whether the sequencing effort is capturing novel transcripts or just duplicating existing ones.
- High saturation means most unique RNA molecules are detected.
- Low saturation indicates many potential molecules are missed, especially rare transcripts or low-abundance genes.
Ensuring optimal saturation maximizes data quality, directly affecting R&D efficiency and therapeutic success in pharma and biotech. Therefore, you need to have a strategic, nuanced sequencing approach such as that offered by Biostate AI for maximizing both scientific value and cost-efficiency.
Understanding sequencing saturation requires not only a conceptual framework but also a deeper dive into the mathematical and computational principles, rooted in transcript distribution and sampling theory.
How to Measure Sequencing Saturation?
The most widely accepted formula for calculating sequencing saturation, notably employed by 10x Genomics’ Cell Ranger pipeline, is:
| Sequencing Saturation = 1 – (n_deduped_reads / n_reads) |
Here,
- n_deduped_reads represents the number of unique combinations of a valid cell barcode, a valid UMI, and a confidently mapped gene. This signifies the number of distinct mRNA molecules detected.
- n_reads refers to the total number of confidently mapped reads that possess a valid cell barcode and a valid UMI.
Interpreting sequencing saturation provides essential insights into how complete your data is. Here’s how it works:
- 50% Saturation: For every two reads confidently mapped to a cell, only one unique transcript is detected. This means there’s still significant room for discovery; further sequencing could uncover more unique transcripts.
- 90% Saturation: For every ten reads, only one unique transcript is detected. Additional sequencing would yield little new information, as most unique transcripts are already captured.
To estimate saturation, scientists often use downsampling (reducing the number of reads) and see how it affects the number of unique UMIs. This helps predict when saturation will plateau, marking 100% saturation.
The cost-benefit analysis based on saturation helps R&D teams make smarter decisions.
- At 50% saturation, more sequencing provides a high return—each additional read uncovers valuable new data.
- But at 90% saturation, the return on investment diminishes, with most new reads being redundant.
For pharma and biotech, this means understanding when to stop sequencing and avoid wasting resources. It helps determine if more depth is needed to capture rare, low-expressed transcripts or if sufficient coverage has already been achieved.
The evolution from PCR duplication rates to sequencing saturation with UMIs represents a major advancement. UMIs tag each RNA molecule before amplification, enabling researchers to count unique molecules and eliminate duplicates accurately. This provides a more precise measure of data completeness, which is crucial for drug discovery and biomarker identification.
Practical Tools for Assessing Sequencing Saturation
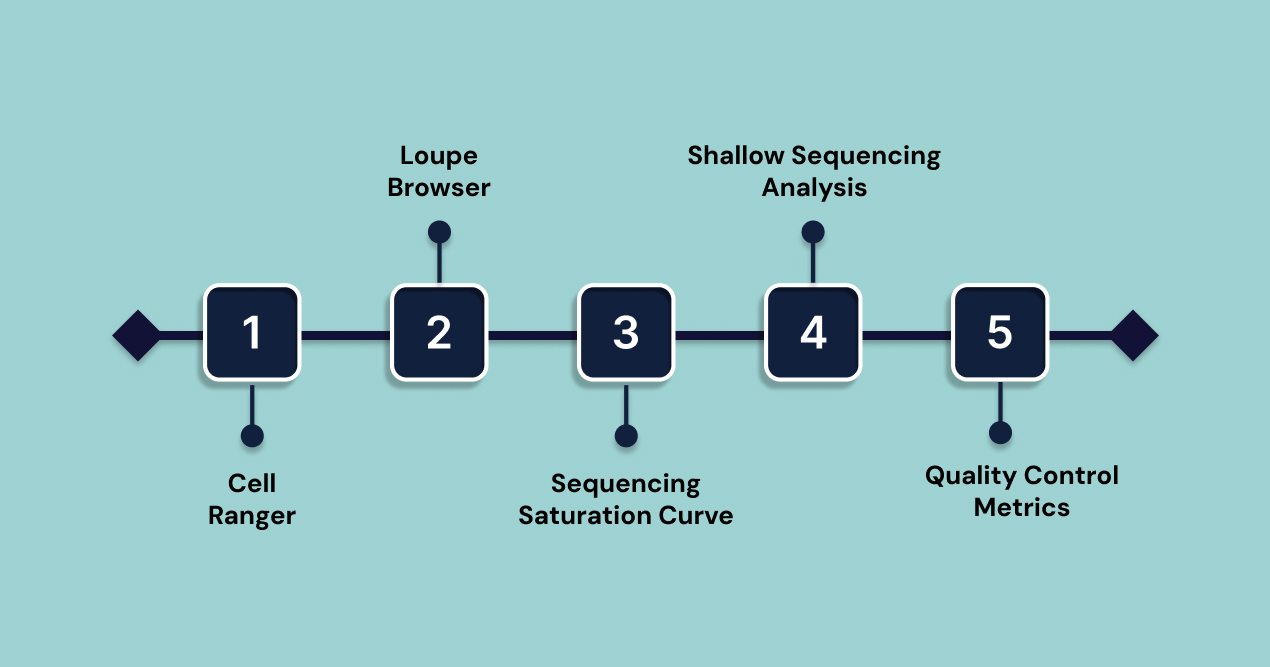
Several computational tools and quality control metrics enable effective monitoring of sequencing saturation in scRNA-seq. For example;
1. Cell Ranger: Cell Ranger is a popular tool for processing 10x Genomics scRNA-seq data. It automatically generates a “Sequencing Saturation” metric in its web summary reports, providing an easy-to-read indicator of data completeness.
- Function: Cell Ranger handles initial data processing, including read alignment, gene counting, and quality control, and outputs key metrics for saturation assessment.
2. Loupe Browser: Loupe Browser is a desktop visualization tool that allows users to explore and analyze Chromium scRNA-seq datasets, including key metrics like sequencing saturation.
- Function: While it’s excellent for visualizing data and performing in-depth analysis, Loupe Browser requires data to be pre-processed by tools like Cell Ranger or Seurat before use.
3. Sequencing Saturation Curve: A diagnostic tool that plots the median number of genes detected per cell against increasing sequencing depth.
- Function: This curve helps determine if further sequencing will significantly increase the number of detected genes or if the library has reached saturation. It’s useful for deciding whether to continue sequencing or if further reads would be redundant.
4. Shallow Sequencing for Saturation Analysis: Initial shallow sequencing on a subset of libraries to assess the quality and cell type composition of the samples.
- Function: This enables researchers to identify if a sample is worth deep sequencing, preventing wasted resources on suboptimal or poorly prepared samples. It’s part of the cost-efficient strategy for assessing saturation before committing to deeper sequencing.
5. Additional Quality Control Metrics:
- Read Count Distribution:
- Work: Evaluates the consistency of sequencing depth across cells.
- Function: Helps assess whether sequencing depth is adequate and consistent, indicating the overall sequencing quality.
- Gene Detection Rate:
- Work: Measures the percentage of genes detected per cell.
- Function: Reflects the assay’s sensitivity, helping to gage whether the sequencing is capturing the diversity of gene expression.
- Proportion of Mitochondrial Reads:
- Work: Tracks the percentage of reads derived from mitochondrial genes.
- Function: High proportions (typically >10-15%) can indicate low-quality or stressed cells, which may affect biological interpretations.
- Doublet Rate:
- Work: Measures the proportion of droplets containing two or more cells.
- Function: High doublet rates can lead to confounded analysis, affecting the interpretation of cell-specific data.
- Cellular Barcode Distribution:
- Work: Assesses the distribution of cell barcodes.
- Function: Helps detect issues with cell multiplexing and potential contamination between cells.
For the pharmaceutical and biotech industries, relying solely on saturation without considering these other crucial quality control parameters risks generating data that is technically “saturated” but biologically compromised. This can lead to misinterpretations of drug effects, inaccurate target identification, or flawed biomarker discovery.
Theoretical understanding of saturation curves is only part of the picture. Real-world applications introduce variables that can alter saturation. So recognizing these factors is key to turning theory into practical success.
Factors Influencing Sequencing Saturation
Sequencing saturation in scRNA-seq is governed by a balance between the complexity of the transcriptomic library (biological sample-intrinsic) and the depth of sequencing (technical design), modulated by amplification biases and the specifics of the scRNA-seq workflow and goals.
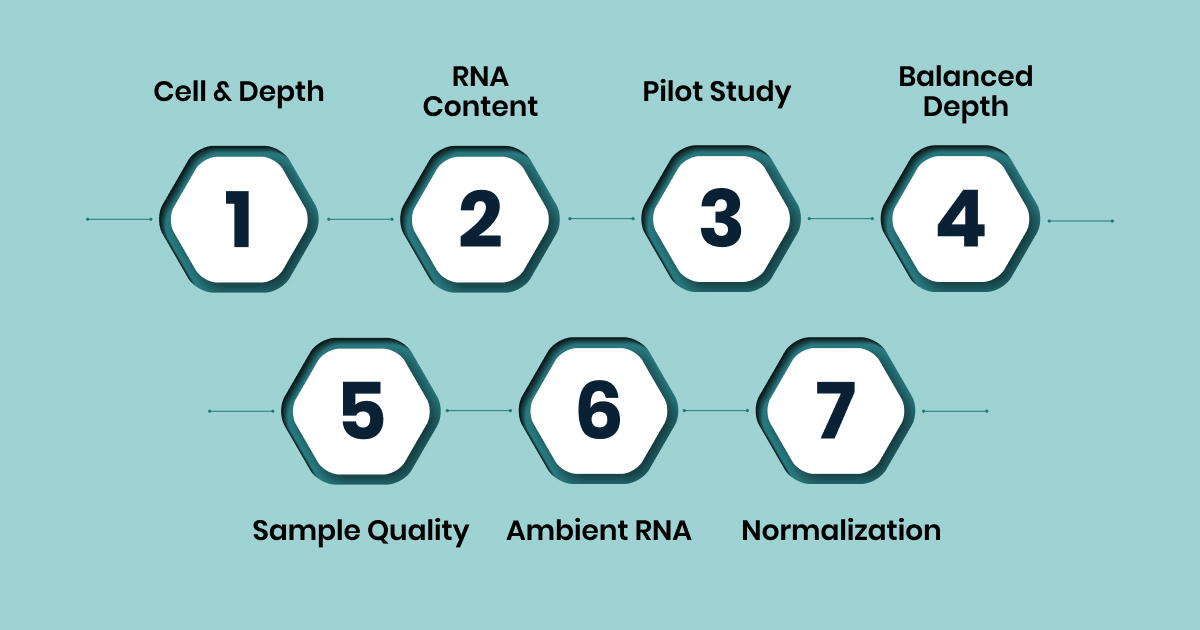
Here are some factors that directly influence sequencing saturation:
- Experimental Design Choices
The number of cells sequenced and the sequencing depth (reads per cell) are crucial.
- Cell Number vs. Depth: More cells with lower depth may be economical, but less detailed. High depth with fewer cells provides greater resolution.
- Sample Homogeneity: Homogeneous populations need less depth for saturation than heterogeneous samples.
- Research Goal: For broad clustering, a lower depth is sufficient. For detecting lowly expressed genes, higher depth is needed.
- Cell Type and RNA Content
- High RNA Content: Cells like primary tissues or cell lines require more depth for accurate profiling (100,000 reads or more).
- Low RNA Content: Rare cells or those with minimal RNA may need maximum saturation to capture detailed data.
- Pilot Studies
Initial shallow sequencing can help assess quality, cell type composition, and guide deeper sequencing decisions for optimal results.
- Balanced Sequencing Across Conditions
Uneven sequencing depth across conditions can cause batch effects, leading to false positives or misleading conclusions. Keeping sequencing depth consistent ensures valid comparisons.
- Sample Preparation Quality
Poor sample preparation (e.g., dead cells, doublets, or ambient RNA) decreases effective sequencing depth, leading to noise and loss of valuable biological signal. Maintaining high cell viability and reducing contamination is key.
- Ambient RNA
Ambient RNA from ruptured cells contaminates samples and can create misleading signals. Specialized techniques like EmptyDrops and SoupX can help eliminate this contaminant.
- Computational Processing
- Normalization: Corrects for technical differences, ensuring observed differences are biological, not technical.
- Batch Effect Correction: Removes variations from different sequencing batches.
- Imputation: Fills in missing gene expressions due to dropout, giving a more complete dataset.
By managing these factors, sequencing saturation can be optimized for specific research goals, ensuring more reliable, actionable data for drug development or disease research. Let’s find out below.
Implications of Sequencing Saturation in Data Analysis
Optimal sequencing saturation is crucial for successful target identification and validation in Pharma and Biotech companies. scRNA-seq helps researchers find rare cell populations with unique gene expression profiles that bulk sequencing often misses.
It also enables the discovery of new cell types, the mapping of cellular differentiation paths, and the understanding of molecular mechanisms behind complex diseases.
Here are a few implications of sequencing saturation in scRNA-seq:
| Application Area | Low Saturation Impact | Optimal Saturation Benefit | Consequences for Pharma/Biotech (of Suboptimal Saturation) |
| Target Identification | Missed low-expressed/rare cell targets; incomplete understanding of disease mechanisms. | Robust discovery of novel, low-expressed targets & rare cell populations; comprehensive disease understanding. | High R&D costs, prolonged development timelines, and missed market opportunities due to overlooked targets. |
| Drug Screening & MoA | Incomplete understanding of cell-type-specific drug responses/off-targets; poor prediction of toxicity. | Precise elucidation of cell-type-specific drug MoA & toxicity; early de-risking of compounds. | Increased attrition rates in clinical trials, higher development costs, and reduced drug safety and efficacy. |
| Biomarker Discovery & Patient Stratification | Suboptimal resolution for precise biomarker identification; inability to stratify patients accurately. | Identification of highly specific and sensitive biomarkers for patient stratification and tailored therapeutic strategies. | Ineffective patient selection, suboptimal treatment outcomes, and limited personalized medicine approaches. |
| Overall R&D Efficiency | Increased false negatives/positives, wasted resources, and delayed pipeline progression. | Accelerated R&D, reduced attrition, enhanced clinical success, maximized data validity. | Compromised data validity, reduced confidence in findings, and inefficient use of resources. |
Suboptimal sequencing saturation increases technical dropout and biases data towards highly expressed genes, leading to an incomplete and misleading transcriptome. Differential expression analysis becomes dependent on sequencing depth, raising false-positive risks. For Pharma/Biotech, this results in wasted resources, higher costs, and delays, while undermining confidence in the data and hindering further investment or clinical progress.
As research projects become more complex, standard saturation methods may fall short. Advanced scenarios require sophisticated strategies beyond traditional optimization.
Strategies to Achieve Optimal Sequencing Saturation
To achieve optimal sequencing saturation in single-cell RNA sequencing (scRNA-seq), careful balance and strategic planning around library complexity and sequencing depth are essential. Here is a practical guide with key strategies:
| Workflow Stage | Key Action/Strategy | Specific Tactic/Tool | Expected Benefit for Pharma/Biotech |
| Experimental Design | Define Clear Objectives | Goal-oriented sequencing depth (e.g., 20k reads/cell for clustering, 50k+ for rare transcripts) | Maximizes ROI by aligning sequencing investment with scientific goals; prevents over/under-sequencing. |
| Balance Experimental Conditions | Process and sequence samples from different experimental groups together; include shared controls | Minimizes batch effects, ensuring robust and comparable data for differential expression analysis. | |
| Sample Preparation (Pre-Library) | Optimize Cell Dissociation | Tissue-specific protocols, gentle dissociation, rapid processing | Preserves cell integrity, minimizes stress responses, reduces technical variation. |
| Ensure High Cell Viability | Aim for >80% viable cells; discard samples with >30% dead cells | Ensures representative transcriptional profiles and reduces background noise. | |
| Remove Contaminants | FACS/MACS for debris/doublet removal; RNAseA treatment for ambient RNA | Increases effective sequencing depth by removing non-biological material and spurious signals. | |
| Library Preparation & Sequencing | Incorporate UMIs | Utilize UMI-based scRNA-seq platforms (e.g., 10x Genomics) | Enables accurate quantification of unique transcripts, distinguishing true signal from PCR duplicates. |
| Perform Pilot Sequencing Runs | Initial shallow sequencing on a subset of libraries | Allows early quality assessment and dynamic adjustment of sequencing depth, optimizing resource allocation. | |
| Leverage High-Throughput Platforms | Utilize NovaSeq, HiSeq for large-scale projects. | Achieves high depth and throughput, enabling comprehensive profiling of many cells/samples. | |
| Utilize Targeted Resampling | Physically recover and re-sequence specific cDNA subsets (e.g., rare cells, specific genes). | Provides hyper-resolution for high-value targets at a fraction of the cost of whole-library deep sequencing. | |
| Computational Analysis | Apply Robust Normalization | Use algorithms like Seurat, scran, DESeq2 | Accounts for technical variations, ensuring accurate comparison of gene expression levels. |
| Implement Batch Correction | Employ tools like Scanorama, BBKNN, Conos, Seurat v3 | Integrates data from multiple batches, removing systematic technical variation to reveal true biological differences. | |
| Employ Imputation Methods | Utilize algorithms such as BISCUIT, SAVER for dropout events | Fills in missing gene expression values, creating a more complete and reliable dataset for analysis. | |
| Leverage AI/ML Approaches | Apply deep learning for imputation, cell type assignment, and pattern recognition. | Extracts maximum value from complex, noisy data, enhancing confidence in biological discoveries. |
Beyond the technical and methodological considerations lies a practical reality that many researchers face: translating theoretical knowledge into actionable solutions that fit within real-world constraints of time, budget, and expertise. Addressing these implementation challenges requires specialized tools and support systems, just like Biostate AI has.
How Biostate AI Can Help You in Achieving Optimal Sequencing Saturation
Achieving optimal sequencing saturation in scRNA-seq can be challenging, often leading to either insufficient coverage or wasted resources with traditional approaches.
Biostate AI solves this with a tailored RNA sequencing platform that combines advanced analytics and cost-effective solutions. Our AI-driven approach analyzes your samples and goals to recommend optimal sequencing parameters, balancing comprehensive coverage with resource efficiency.
Our service offers:
- AI-Enhanced Analysis: Our OmicsWeb platform provides intelligent saturation analysis with real-time optimization recommendations
- Flexible Sample Requirements: Process samples as small as 10µL blood or 10ng RNA, enabling saturation analysis even with limited material
- Cost-Effective Solutions: High-quality sequencing starting at $80/sample allows for comprehensive saturation studies without budget constraints
- Rapid Turnaround: Receive your saturation analysis and results in just 1–3 weeks, accelerating your research timeline
- Complete Transcriptome Coverage: Our total RNA-seq captures both mRNA and non-coding RNA for comprehensive saturation assessment.
- Low RIN Compatibility: Compatible with degraded samples (RIN as low as 2) that typically complicate saturation analysis
Our integrated platform eliminates the guesswork from saturation optimization, providing you with the precise sequencing depth needed for your specific research objectives while maximizing the value of every sequencing dollar invested.
Final Words
Understanding sequencing saturation in single-cell RNA-seq is essential for researchers to maximize experimental value. This framework guides decisions on sequencing depth, resource allocation, and experimental design, ensuring an optimal balance between coverage and constraints.
Biostate AI simplifies saturation optimization into a cost-effective solution, starting at $80 per sample. Our AI-driven platform offers comprehensive analysis, rapid turnaround, and flexible sample requirements to achieve perfect saturation and full transcriptome coverage, removing traditional barriers in scRNA-seq experiments.
Optimize your single-cell RNA sequencing with Biostate AI’s smart saturation analysis. Contact us today to maximize your research outcomes and budget efficiency.
FAQs
Q: Can I use saturation analysis to predict optimal sequencing depth for future experiments with different cell types?
Saturation patterns are cell-type specific, so results may not transfer directly between different cell types. Highly differentiated cells need fewer reads for saturation, while transcriptionally complex cells require more. Pilot studies or published datasets can help predict depth, with deeper sequencing needed for rare transcript detection.
Q: How do batch effects interact with sequencing saturation, and should I account for this in multi-batch experiments?
Batch effects can distort saturation levels across different sequencing runs. Standardize saturation analysis within each batch and apply batch correction methods during downstream analysis. Use spike-in controls or technical replicates to monitor consistency across batches.
Q: What’s the relationship between sequencing saturation and the detection of alternative splicing events in single cells?
Alternative splicing requires deeper sequencing coverage, particularly across exon-exon junctions. Standard saturation analysis may not capture the depth needed for reliable splicing detection. Typically, 2-3 times more depth is required for splicing than for gene expression studies.
Q: How does the choice between UMI-based and non-UMI protocols affect saturation analysis and interpretation?
UMI-based protocols reduce PCR bias, offering more accurate saturation curves that reflect true transcript abundance. Non-UMI protocols may show apparent saturation due to amplification artifacts. UMI-based approaches require deeper sequencing but provide more reliable quantification.