
Over 90% of new drugs fail to benefit most patients. The main reason? Disease isn’t uniform. Cells within the same tissue often behave very differently. This hidden diversity, known as cellular heterogeneity, means that what works for one cell type may fail for another.
We understand that this complexity and variability can be frustrating for researchers and clinicians striving to develop effective treatments, as it often feels like an uphill battle to capture these subtle yet critical differences.
Traditional RNA sequencing methods fall short here. By averaging gene expression across thousands of cells, bulk RNA-seq blurs the unique signals driving disease in small but crucial cell groups. As a result, rare drug-resistant cells or disease-driving subpopulations often go undetected.
Single-cell RNA sequencing (scRNA-seq) changes the game. By analyzing gene expression at the individual cell level, scRNA-seq differential expression analysis uncovers these hidden cell populations and their unique behaviors. This precision reveals the true complexity of disease, helping researchers identify new drug targets and develop more effective, personalized treatments.
In this blog, we’ll explore how scRNA-seq differential expression analysis is reshaping disease research, exposing what bulk methods miss, and opening the door to breakthroughs in precision medicine.
TL;DR
- scRNA-seq differential expression analysis reveals hidden cell diversity, helping identify new drug targets and enabling more precise, personalized treatments.
- The process requires careful data cleaning, normalization, clustering, and multiple testing correction to ensure accurate results.
- Specialized statistical methods and visualization tools are essential to handle the unique challenges of single-cell data, such as high sparsity and technical noise.
- Choosing the right analysis approach and addressing technical limitations are key to unlocking the full potential of scRNA-seq for disease research
What is scRNA-seq Differential Expression Analysis
Differential Expression (DE) analysis is a core technique in genomics, used to identify genes whose expression levels change between conditions, such as healthy versus diseased tissue.
| Feature | Bulk RNA-Seq | Single-Cell RNA-Seq |
| Resolution | Average across many cells | Measures each cell individually |
| Cell-type specificity | Low | High |
| Detection of rare populations | Poor | Excellent |
| Heterogeneity | Masked | Revealed |
| Developmental trajectories | Not accessible | Trackable at the single-cell level |
Traditionally, researchers have relied on bulk RNA sequencing (RNA-seq), which measures the average gene expression across thousands or millions of cells.
However, this approach can mask important biological signals, especially when tissues contain a mix of different cell types. Single-cell RNA sequencing (scRNA-seq) overcomes these limitations, offering unprecedented resolution and insight.
DE analysis is used to identify genes that show statistically significant differences in expression between groups or conditions within a population of single cells. Hence, it is important to know about statistical approaches in DE analysis.
Statistical Approaches in scRNA-seq Differential Expression Analysis
Effectively identifying DE genes in scRNA-seq data requires specialized statistical methods. These methods account for the unique properties of single-cell data, such as high sparsity (many zero counts) and overdispersion.
Here are some widely used and currently relevant statistical approaches:
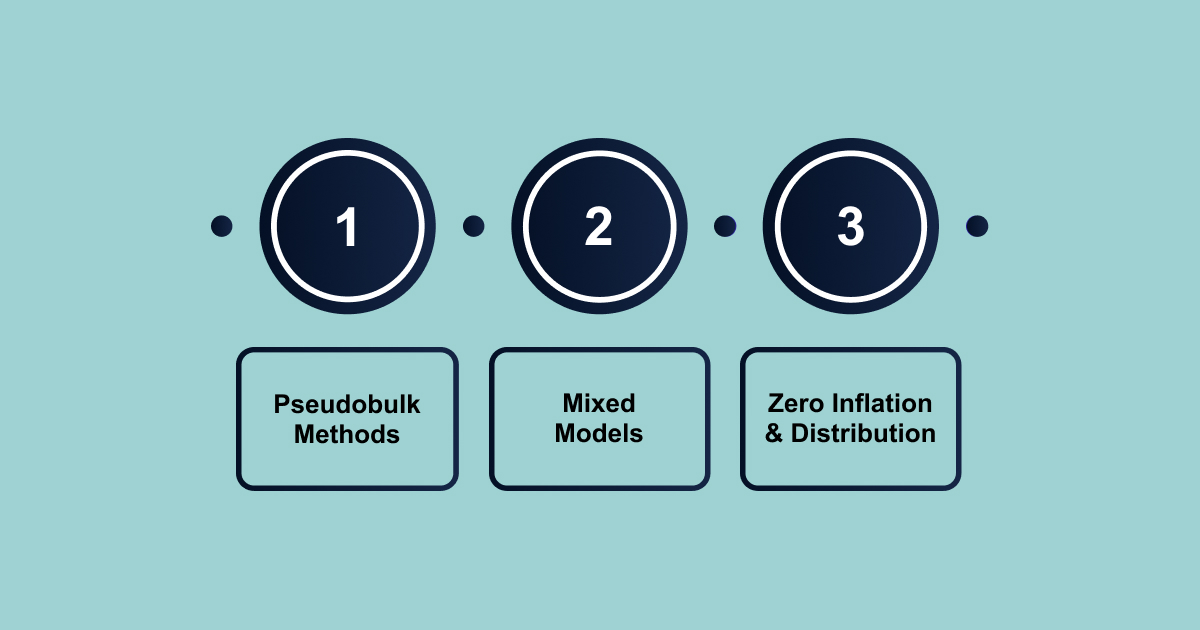
- Pseudobulk Methods
This approach aggregates gene counts from individual cells within the same biological sample and cell type, effectively creating “pseudobulk” samples. You then apply statistical methods originally designed for bulk RNA-seq data to these aggregated counts.
- Advantages: Simplicity and ability to leverage mature, robust bulk RNA-seq DE tools. It naturally handles biological replicates at the sample level.
- Common Tools:
- DESeq2: Employs a negative binomial generalized linear model to account for count data and overdispersion.
- edgeR: Uses a negative binomial distribution and empirical Bayes methods to estimate gene-wise dispersion.
- limma-voom: Transforms count data to log2-counts per million (logCPM) and estimates mean-variance relationships for linear modeling.
- Mixed Models
These models directly incorporate biological replicates (e.g., individual patients or samples) as random effects. This accounts for the correlation between cells from the same subject, providing more accurate statistical inference.
- Advantages: Addresses pseudo-replication bias inherent in multi-subject scRNA-seq datasets.
- Common Tools:
- MAST (Model-based Analysis of Single Cell Transcriptomics): Uses a hurdle model, which combines a logistic regression for the probability of expression and a Gaussian linear model for the non-zero expression values. It supports random effects for multi-condition DE analysis.
- NEBULA (Negative Binomial Mixed Model for Differential or Co-expression Analysis): A fast method for large-scale multi-subject single-cell data, using a negative binomial mixed model.
- Methods Accounting for Zero Inflation/Differential Distribution
These approaches specifically address the high number of zero counts (dropouts) in scRNA-seq data or aim to detect subtle shifts in the entire distribution of gene expression, not just the mean.
- Advantages: More directly models the dropout phenomenon and can identify differential patterns beyond simple mean changes.
- Common Tools:
- SCDE (Single Cell Differential Expression): Employs a two-component mixture model (Poisson and negative binomial) to model gene expression, with a Bayesian approach for differential expression.
- distinct: Focuses on differential distribution testing, assessing differences in entire gene expression distributions between conditions using hierarchical permutation tests.
Choosing the right method often depends on your experimental design, the specific biological question, and the characteristics of your dataset. Many tools also offer flexibility in their underlying statistical tests (e.g., Wilcoxon rank-sum test, likelihood ratio test), allowing you to tailor the analysis.
In the next section, we will detail the scRNA-seq differential expression analysis workflow, including quality control, normalization, clustering, statistical testing, and interpretation.
How is scRNA-seq Differential Expression Analysis Performed?
Differential Expression (DE) analysis in single-cell RNA sequencing (scRNA-seq) is a critical step.Before performing differential expression analysis, single-cell RNA-seq data requires several crucial preprocessing steps.
These steps clean and prepare the data, ensuring that downstream analysis are accurate and reliable.
1. Quality Control (QC) and Filtering
The purpose of this step is to remove technical artifacts and low-quality data.
- Steps:
- Remove empty droplets: Contain only background RNA.
- Identify dead or dying cells: They typically have high mitochondrial gene content.
- Detect and remove cell doublets: Multiple cells mistakenly captured as one.
- Tools for QC:
- FASTQC / MultiQC: Initial sequencing quality check.
- Scrublet / scDblFinder: Identify and remove doublets.
- SoupX / CellBender: Address ambient RNA contamination.
- Importance of QC:
- Ensures that technical noise doesn’t overshadow biological signals.
- Poor QC can lead to false positives or negatives in DE analysis.
After QC, the next logical step is to normalize the data to correct for biases such as varying sequencing depth between cells.
2. Normalization and Transformation
Since single-cell RNA-seq data is sparse and contains varying sequencing depths, normalization is necessary to correct for these biases.
- Normalization Approaches:
- SCTransform: Uses a regularized negative binomial regression model to adjust for sequencing depth and gene-specific effects.
- scran Deconvolution: Pools counts from multiple cells to estimate size factors, which are deconvolved back to individual cells.
- Importance:
- Reduces the impact of highly expressed genes.
- Stabilizes variance and ensures comparability across cells.
- Special methods like SCTransform and scran deconvolution are crucial due to the sparsity and overdispersion in scRNA-seq data.
After normalizing the data, we move to the step where we group cells based on their gene expression profiles: clustering.
Cell Clustering and Annotation
Now that the data is normalized, we can group cells with similar expression profiles into distinct clusters using various clustering methods.
1. Clustering
The purpose of this step is to group cells with similar expression profiles into clusters (often representing distinct cell types or states). This can be done using:
- K-means clustering: Grouping cells based on a predefined number of clusters.
- Hierarchical clustering: Grouping cells by progressively merging or splitting clusters.
- Graph-based clustering (e.g., Louvain or Leiden algorithm): Using a graph of nearest neighbors to identify clusters.
- Techniques:
- Dimensionality Reduction:
- PCA: Principal Component Analysis.
- UMAP: Uniform Manifold Approximation and Projection.
- t-SNE: t-Distributed Stochastic Neighbor Embedding.
- Clustering Algorithms:
- Louvain and Leiden algorithms to identify cell groups.
- Dimensionality Reduction:
2. Annotation
This step is performed to identify cell types based on gene expression profiles.
- Method: Identify “marker genes”, genes highly expressed in a specific cluster.
- Feedback Loop:
- DE analysis identifies marker genes, refining cluster annotations.
- Clustering helps define cell populations for DE analysis.
Once clustering is done, the next step is multiple testing correction. This is crucial because we are comparing the expression of many genes across different clusters, which can increase the likelihood of false positives.
Multiple Testing Correction
When performing DE analysis in scRNA-seq, researchers test thousands of genes simultaneously. This increases the likelihood of false-positive results occurring purely by random chance.
For example, if testing 10,000 genes with a p-value cutoff of 0.05, approximately 500 genes could appear “significant” even if no true differences exist.
To control for false positives, correction methods adjust the p-values obtained in DE analysis.
1. Benjamini-Hochberg (B-H) Procedure
- Purpose: Controls the False Discovery Rate (FDR).
- FDR Cutoff Example: An FDR cutoff of 0.05 means that approximately 5% of the genes identified as differentially expressed are expected to be false positives.
- Advantage: Balances the detection of true differentially expressed genes while controlling false positives.
2. Other Methods (e.g., Bonferroni Correction)
- Bonferroni Correction: More conservative and stringent than B-H, leading to higher chances of false negatives (missing true signals).
- Drawback: Can be too conservative, reducing sensitivity and increasing the chance of missing true biologically significant changes.
Testing correction helps prevent random fluctuations from being misinterpreted as meaningful biological changes.
Once we’ve applied corrections, it’s time to move to visualization, where we can present the differential expression results in an interpretable way.
Visualization
Visualizing differential expression results is essential for interpreting findings and communicating them effectively. Common visualization types include:
- Volcano Plots: These plots display the relationship between the statistical significance (p-value) and the magnitude of change (log-fold change) for each gene, quickly highlighting genes that are both highly significant and substantially differentially expressed.
- Heatmaps: Heatmaps show the expression patterns of a set of genes across different cell types or conditions, allowing for the visualization of clusters of co-expressed genes.
- Violin Plots: These plots illustrate the distribution of a specific gene’s expression across different cell clusters, providing a detailed view of its expression variability within and between groups.
- UMAP/t-SNE Plots with Gene Expression Overlays: These dimensionality reduction plots, fundamental for visualizing cell populations, can be overlaid with gene expression levels to show where specific genes are highly expressed within the cellular landscape.
Finally, to gain deeper insights from these differentially expressed genes, we can proceed with the biological interpretation.
Biological Interpretation
Once the differentially expressed genes (DEGs) are identified, further analysis can provide biological insights:
- Gene Ontology (GO) or Pathway Enrichment Analysis: Identify whether the DEGs are enriched for specific biological processes or pathways.
- Marker Gene Identification: Explore whether specific DEGs are known marker genes for specific cell types or conditions.
- Gene Set Enrichment Analysis (GSEA): Test if predefined gene sets (e.g., related to pathways or biological processes) are differentially expressed across conditions.
Regardless of the chosen method, careful preprocessing and quality control of your scRNA-seq data remain paramount for obtaining reliable differential expression results. However, there are still some challenges in conducting scRNA-seq differential expression analysis.
Challenges in Conducting scRNA-seq Differential Expression Analysis
Differential expression analysis in single-cell RNA sequencing presents unique computational and statistical hurdles that distinguish it from bulk RNA-seq approaches. These challenges stem from the technology’s inherent limitations, data characteristics, and the complex biology of individual cells.
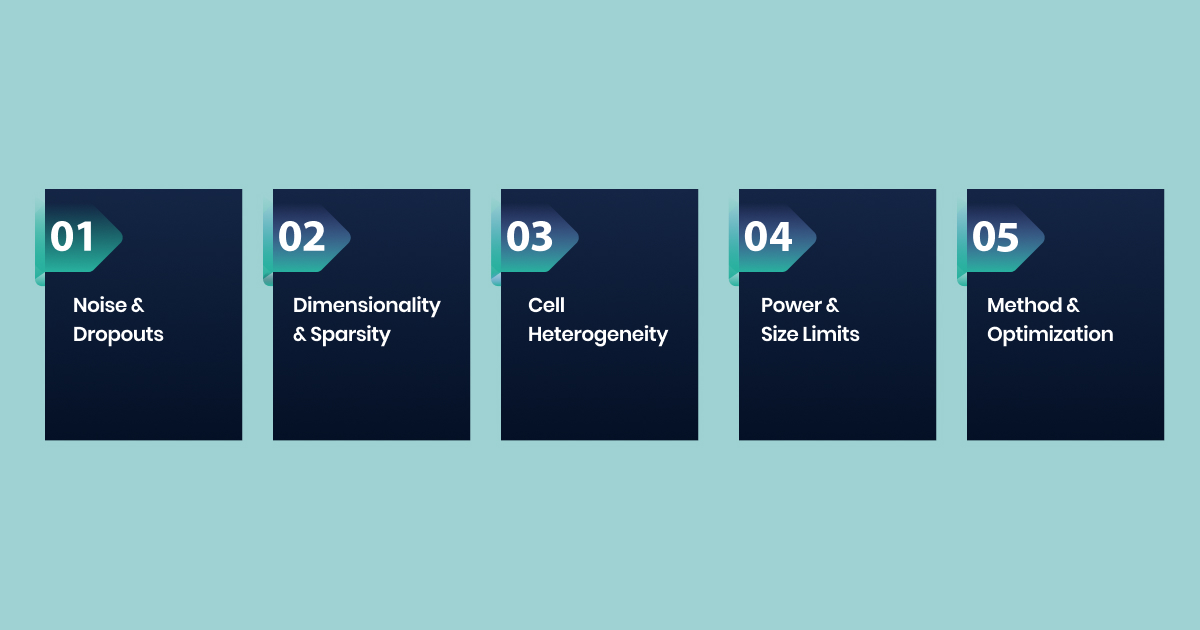
1. Technical Noise and Dropout Events
Single-cell RNA sequencing introduces substantial technical artifacts that obscure genuine biological signals during differential expression analysis.
- Amplification bias distorts gene expression measurements. PCR amplification creates uneven representation of transcripts, making some genes appear more or less expressed than they actually are.
- Dropout events create false zeros in the data matrix. Low-abundance transcripts often fail to be detected, creating artificial zero counts that complicate downstream analysis.
- Batch effects confound biological signals. Different sequencing runs, reagent lots, or processing dates introduce systematic variations that mask true biological differences.
2. High Dimensionality and Sparsity
The technical noise problem compounds with sc-RNA-seq data’s inherent structural challenges of extreme sparsity and high dimensionality.
- Sparse count matrices challenge statistical methods. Most genes show zero expression in most cells, creating datasets where 70-90% of values are zeros.
- High feature-to-sample ratios increase the multiple testing burden. Testing 20,000+ genes across hundreds of cells dramatically inflates the risk of false discoveries.
- Traditional statistical assumptions break down. Standard DEA methods assume normal distributions, but sc-RNA-seq data follow zero-inflated negative binomial patterns.
3. Cell Population Heterogeneity
Beyond data structure issues, the biological complexity of mixed cell populations creates additional layers of analytical difficulty.
- Mixed cell populations mask subgroup-specific signals. Averaging expression across diverse cell types dilutes true differences within specific populations.
- Rare cell types get overwhelmed by abundant populations. Statistically significant changes in small cell clusters become undetectable when mixed with larger groups.
- Cell state transitions create continuous expression gradients. Discrete statistical tests struggle to capture smooth biological processes like differentiation or activation.
4. Power and Sample Size Limitations
Cell heterogeneity problems intersect with fundamental limitations in statistical power that plague most scRNA-seq experiments.
- Low sequencing depth per cell reduces detection sensitivity. Shallow sequencing fails to capture lowly expressed genes that may be biologically important.
- Small cell numbers within conditions limit statistical power. Many studies lack sufficient cells per group to detect modest but meaningful expression changes.
- Effect size estimation becomes unreliable. High variability combined with small sample sizes makes it difficult to distinguish biological significance from statistical significance.
5. Method Selection and Parameter Optimization
Statistical power limitations ultimately force researchers to navigate complex methodological choices without clear guidance or standards.
- No universal best method exists for all datasets. Different DEA tools (DESeq2, edgeR, MAST, Wilcoxon) perform better under different conditions and assumptions.
- Normalization choices dramatically affect results. Size factor normalization, TPM, RPKM, and other methods can lead to conflicting conclusions from the same data.
- Threshold selection lacks standardized guidelines. Choosing cutoffs for fold change, p-values, and minimum expression levels remains largely arbitrary and study-dependent.
However, these challenges are not insurmountable when approached with the right combination of standardized protocols and advanced analytics. The key lies in addressing multiple challenge layers simultaneously rather than tackling each problem in isolation.
How Biostate AI Transforms sc-RNA-Seq DE Analysis Challenges Into Opportunities
The challenges outlined above create significant barriers for researchers conducting differential expression analysis on single-cell RNA sequencing data. They often force scientists to spend more time wrestling with data processing than focusing on their core biological questions.
Biostate AI provides a complete solution that addresses these exact pain points through an integrated platform combining high-quality sequencing, advanced analytics, and AI-powered insights.
Key Solutions for sc-RNA-Seq Challenges:
Cost-Effective RNA-seq Service – Delivers high-quality sequencing results starting at $80/sample with rapid 1-3 week turnaround times, eliminating technical noise through standardized protocols and quality controls.
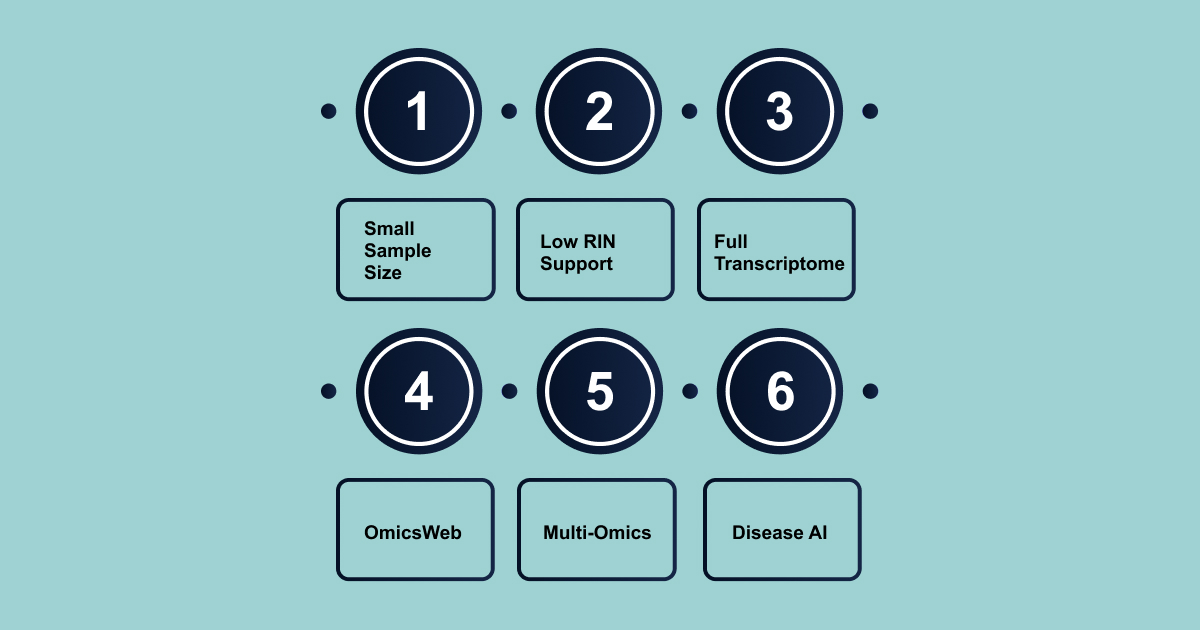
- Minimal Sample Requirements – Processes samples as small as 10µL blood, 10ng RNA, or 1 FFPE slide, maximizing statistical power even with limited biological material.
- Low RIN Compatibility – Works with degraded RNA samples having RIN as low as 2 (versus typical ≥5 requirements), expanding the range of usable samples for analysis.
- Complete Transcriptome Coverage – Captures both mRNA and non-coding RNA in a single experiment, providing comprehensive expression profiles that reduce dropout events.
- OmicsWeb Platform – Offers automated analysis pipelines that handle high-dimensional, sparse data without requiring coding expertise, streamlining method selection and parameter optimization.
- Multi-omics Integration – Supports RNA-Seq, WGS, methylation, and single-cell data within one platform, facilitating comprehensive biological interpretation.
- Disease Prognosis AI – Transforms RNA data into predictive models using Biobase, achieving 89% accuracy in drug toxicity prediction and 70% accuracy in therapy selection.
Biostate AI‘s integrated approach transforms the traditional bottlenecks of sc-RNA-seq analysis into streamlined workflows, enabling researchers to extract meaningful biological insights without getting lost in technical complexities.
Final Words!
scRNA-seq differential expression analysis provides a powerful way to uncover hidden cell populations and disease mechanisms that bulk RNA-seq often misses. By following a careful workflow, quality control, normalization, clustering, and robust statistical testing, researchers can identify rare cell types, reveal new drug targets, and drive advances in precision medicine.
To make this process accessible and affordable, Biostate AI offers an AI-driven tool for scRNA-seq differential expression analysis at just $80 per sample. Its intelligent algorithms minimize technical noise, handle high-dimensional sparse data, and accurately identify rare cell populations.
Get in touch today to see how Biostate AI can transform your scRNA-seq differential expression analysis and drive your research forward.
FAQs
- How do I decide on the best quality control thresholds for scRNA-seq differential expression analysis?
Choosing the right quality control (QC) thresholds is crucial to balance the removal of low-quality cells with preserving biological diversity.
- Common metrics include total counts per cell, number of genes detected, and mitochondrial gene proportion.
- Thresholds should be adjusted based on your experimental conditions and expected biology, as overly strict filtering can remove rare cell types, while lax filtering retains technical noise.
- Tools like violin plots and cumulative distribution functions help visualize these metrics for informed threshold selection.
- What are the most common sources of technical noise in scRNA-seq data, and how can they be minimized?
Technical noise in scRNA-seq data often arises from cell dissociation, library preparation errors, sequencing depth, and ambient RNA contamination. Minimizing these issues requires careful experimental design, rigorous QC, and use of spike-in controls or empty droplet removal techniques. Automated QC pipelines and advanced computational methods can help identify and filter out these artifacts before downstream analysis.
- How does batch effect correction impact scRNA-seq differential expression results?
Batch effects can arise from differences in sample preparation, sequencing runs, or laboratory conditions, leading to false positives or negatives in differential expression analysis. Correcting for batch effects using methods like Harmony, Seurat, or ComBat ensures that biological differences, not technical artifacts, drive your results. This step is especially important when combining datasets from multiple sources or experiments.
- What are the best practices for cell type annotation in scRNA-seq datasets?
Cell type annotation involves assigning cell identities based on gene expression profiles, often using reference datasets and marker genes. Best practices include using multiple independent markers, cross-referencing with databases like CellMarker or PanglaoDB, and validating annotations with visualization tools such as UMAP or t-SNE plots. Manual inspection and integration of domain knowledge further improve accuracy.
- How should I handle missing data or dropouts in scRNA-seq differential expression analysis?
Missing data (dropouts) are common in scRNA-seq due to low RNA capture rates and technical limitations. Imputation methods like MAGIC, scImpute, or SAVER can help recover missing values, but should be used cautiously to avoid introducing false signals. Evaluating the impact of imputation on downstream results is recommended to ensure data integrity.